2018 College Football Bowl Predictions
If you are more interested in this year’s game predictions than technical background and a recap of last year’s performance, skip ahead to the Predictions section.
Last year I posted about predicting the 2017 bowl game outcomes using a model based on PageRank. Now on New Years Eve 2018, with a lot of the most exciting matchups of this year’s bowl season kicking off in the next couple of days, I wanted to revisit that model, and discuss some improvements I have made to it since last year. And, of course, there’s no time like the present to post this year’s predictions both for the remaining 10 bowl games and retrospectively apply the model to the few dozen that have already been played.
2017 Model Retrospective
At a first glance, the 2017 model did a poor job of predicting the most meaningful matchups – neither model I presented correctly predicted the Georgia vs. Alabama national championship matchup, much less the result. But let’s dig a beat deeper and see how the models performed across all bowl games predicted against Vegas spreads and over-unders as well as raw rate of correctly predicting the winner:
| Model | Winner Prediction Rate | Beat Spread Rate | Beat Over-Under Rate |
|---|---|---|---|
| Random Forest with PageRank on wins | 0.56 (22/39) | 0.64 (25/39) | 0.49 (19/39) |
| Random Forest with PageRank on victory margin | 0.64 (25/39) | 0.49 (19/39) | 0.46 (18/39) |
This honestly looks pretty noisy and uninspiring, so this season I began to look for patterns of weakness in the model. While there are a number of blind spots to things like injuries and recent personnel changes, I ended up honing in on one larger trend: the model tends to massively underpredict total points scored in a handful of games, while only slightly overpredicting points in the rest. I.e. it doesn’t see the shootouts coming. To draw on a couple of examples from last year’s bowl season (which were corroborated by predictions in this year’s regular season), consider the Belk Bowl and the Rose Bowl (examples are taken from last year’s model including margin of victory, but the issue existed in both models):
55 wake forest (nc) @ texas a&m 52:
  Predicted: 38-34 (correct=True)
  Spread: 3.5 (correct=False)
  Over-Under: 63.0 (correct=True)
54 georgia @ oklahoma 48:
  Predicted: 30-31 (correct=False)
  Spread: 2.0 (correct=False)
  Over-Under: 63.0 (correct=False)
In both cases, teams were facing an opponent that played very differently than the teams they had played all year. In the Belk Bowl, A&M was facing a Wake Forest offense that focused much more on the pass than most of their SEC competition had all year. Georgia was facing a similar situation with the matchup against OU in the Rose Bowl. The result was that in both games, teams ended up with more passing-oriented offense than they had used throughout the regular season, producing quicker drives on the game clock and many more points than the model predicted. Last year’s model included features for overall team strength, overall conference strength, and total points per game, with which we’re unable to represent this kind of nuance. In particular, the points per game feature (which has the second highest feature importance in the model after the difference in pagerank between opponents) is in many cases based on an unrepresentative set of opponents, and the model’s only way to combat this is with the overall team strength modeled by PageRank.
New Features
I made one major change this year to better react to the effects of the matchup on overall scoring: I added new features for opponents’ rushing yards and passing yards per game. There are a number of ways to do this that would arguably be better, e.g. structuring the model around first predicting passing yards and rushing yards in isolation, or clustering teams based on the type of offense and defense they run and modelling strength against those clusters. I expect that in future seasons I will try some of these ideas, but for now I wanted to see how much I could improve a simple model through better feature selection.
These two new features appear to be a step in the right direction, both anecdotally looking at high scoring games (e.g. in week 4 when Florida beat Tennessee 47-21, the new model had predicted a 39-15 outcome while the old one had predicted 27-16), and in model performance on average. See below the performance of a Random Forest model using PageRank on victory margin for both the new feature vectors and the old ones, evaluated on predictions in weeks 3 through 14:
| Model | Winner Prediction Rate | Beat Spread Rate | Beat Over-Under Rate |
|---|---|---|---|
| Last year’s model | 0.72 (494/687) | 0.54 (358/667) | 0.56 (355/634) |
| Model with new features | 0.73 (503/687) | 0.56 (373/667) | 0.59 (377/634) |
Model for 2018 Predictions
To summarize, this year’s model produces independent predictions for each teams’ points given the following features:
pr_diff, the difference in PageRank between the team and their opponent. This was calculated using a graph of the entire regular season results, using margin of victory to weight the edges.conf_pr_diff, the difference in PageRank between the teams’ conferences given regular season results. Unit weight was always used for edges.ap_rank_diff, the difference in the week 14 AP poll ranking between the team and their opponent. All unranked teams were treated as tied for 26.opp_points_allowed, the average points the opponent allowed per game in the regular season.ppg, the average points per game scored by the team.opponent_rypg, the average number of rushing yards scored by the opposing team over the course of the seasonopponent_pypg, the average number of passing yards scored by the opposing team over the course of the season
Using this feature vector, I trained a random forest model on 90% of regular season results, with each leaf representing a minimum of four samples. Presented below are some overall stats on this year’s model versus last year’s:
| Model | 2017 model | 2018 model |
|---|---|---|
| Train R^2 | 0.77 | 0.77 |
| Test R^2 | 0.55 | 0.59 |
pr_diff importance |
0.37 | 0.39 |
conf_pr_diff importance |
0.04 | 0.03 |
ap_rank_diff importance |
0.02 | 0.01 |
opp_points_allowed importance |
0.31 | 0.31 |
ppg importance |
0.25 | 0.20 |
opponent_rypg importance |
N/A | 0.03 |
opponent_pypg importance |
N/A | 0.03 |
Predictions
Following are the predictions produced by the model described above, followed by the actual results in cases where games have already been played to completion.
| Bowl Game | Prediction | Actual Result |
|---|---|---|
| Cure Bowl | tulane (la) 36 la lafayet 22 |
tulane (la) 41 la lafayet 24 |
| New Mexico Bowl | utah state 41 unt 21 |
utah state 52 unt 13 |
| Las Vegas Bowl | arizona state 14 #19 fresno state 29 |
arizona state 20 #19 fresno state 31 |
| Camellia Bowl | georgia southern 20 eastern michigan 40 |
georgia southern 23 eastern michigan 21 |
| New Orleans Bowl | middle tenn state 16 appalachian state 35 |
middle tenn state 13 appalachian state 45 |
| Boca Raton Bowl | uab 26 niu 10 |
uab 37 niu 13 |
| Frisco Bowl | s diego state 29 ohio 28 |
s diego state 0 ohio 27 |
| Gasparilla Bowl | marshall (wv) 34 south florida 19 |
marshall (wv) 38 south florida 20 |
| Bahamas Bowl | fiu 25 toledo (oh) 36 |
fiu 35 toledo (oh) 32 |
| Idaho Potato Bowl | western michigan 22 alcorn state 39 |
western michigan 18 alcorn state 49 |
| Birmingham Bowl | memphis 36 wake forest (nc) 41 |
memphis 34 wake forest (nc) 37 |
| Armed Forces Bowl | houston 25 #22 army 51 |
houston 14 #22 army 70 |
| Dollar General Bowl | buffalo 27 troy 31 |
buffalo 32 troy 42 |
| Hawaii Bowl | louisiana tech 36 hawaii 23 |
louisiana tech 31 hawaii 14 |
| First Responder Bowl | boston college 25 #23 boise state 35 |
|
| Quick Lane Bowl | minnesota 30 georgia tech 31 |
minnesota 34 georgia tech 10 |
| Cheez-It Bowl | cal 18 tcu 17 |
cal 7 tcu 10 |
| Independence Bowl | temple (pa) 34 duke 30 |
temple (pa) 27 duke 56 |
| Pinstripe Bowl | miami (fl) 22 wisconsin 21 |
miami (fl) 3 wisconsin 35 |
| Texas Bowl | baylor 25 vanderbilt 34 |
baylor 45 vanderbilt 38 |
| Music City Bowl | purdue 27 auburn 32 |
purdue 14 auburn 63 |
| Camping World Bowl | #15 west virginia 50 #17 syracuse 35 |
#15 west virginia 18 #17 syracuse 34 |
| Alamo Bowl | #25 iowa state 25 #12 washington state 28 |
#25 iowa state 26 #12 washington state 28 |
| Belk Bowl | south carolina 27 virginia 25 |
south carolina 0 virginia 28 |
| Peach Bowl | #10 florida 24 #8 michigan 37 |
#10 florida 41 #8 michigan 15 |
| Arizona Bowl | arkansas state 31 nevada 31 |
arkansas state 13 nevada 16 |
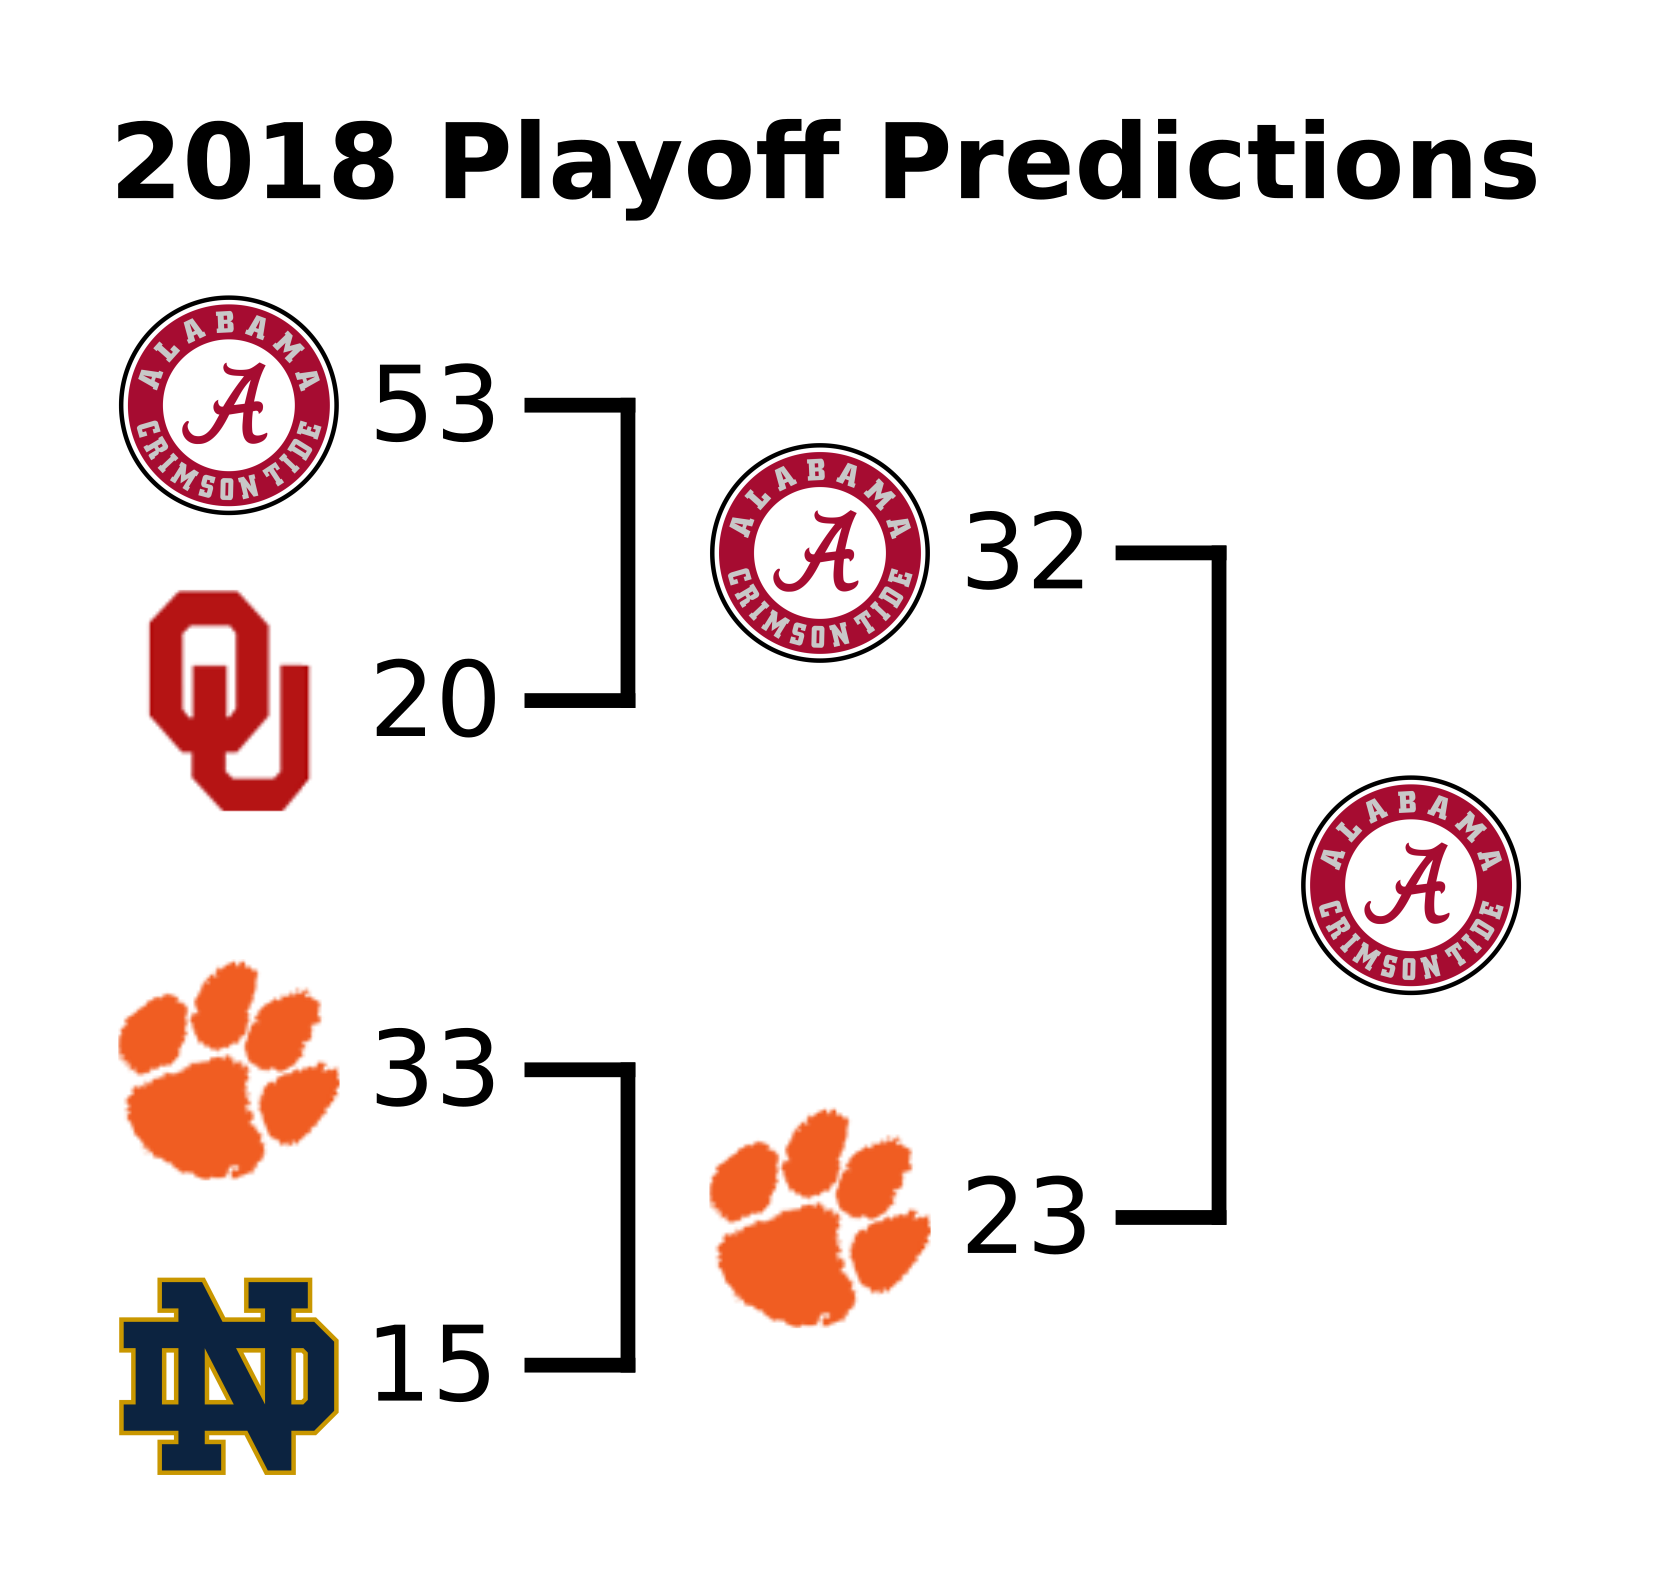
| Cotton Bowl | #3 notre dame 15 #2 clemson 33 |
#3 notre dame 3 #2 clemson 30 |
| Orange Bowl | #4 oklahoma 20 #1 alabama 53 |
#4 oklahoma 34 #1 alabama 45 |
| Military Bowl | cincinnati 35 virginia tech 17 |
cincinnati 35 virginia tech 31 |
| Sun Bowl | stanford 22 pitt 25 |
stanford 14 pitt 13 |
| Redbox Bowl | michigan state 21 oregon 23 |
michigan state 6 oregon 7 |
| Liberty Bowl | #24 missouri 37 oklahoma state 30 |
#24 missouri 33 oklahoma state 38 |
| Holiday Bowl | northwestern 19 #20 utah 20 |
northwestern 31 #20 utah 20 |
| TaxSlayer Bowl | nc state 31 #21 texas a&m 27 |
nc state 13 #21 texas a&m 52 |
| Outback Bowl | #18 mississippi state 12 iowa 25 |
#18 mississippi state 22 iowa 27 |
| Citrus Bowl | #16 kentucky 20 #13 penn state 29 |
#16 kentucky 27 #13 penn state 24 |
| Fiesta Bowl | #11 lsu 28 #7 ucf 32 |
#11 lsu 40 #7 ucf 32 |
| Rose Bowl | #9 washington 25 #5 ohio state 31 |
#9 washington 23 #5 ohio state 28 |
| Sugar Bowl | #14 texas 28 #6 georgia 35 |
#14 texas 28 #6 georgia 21 |
| CFP Championship | #2 clemson 23 #1 alabama 32 |
#2 clemson 44 #1 alabama 16 |
I fully intend to continue to improve this model in coming seasons. The next step is probably more expressive data to create a model with even more awareness for matchup qualities and the value provided by individual players.
References and Code
- The script that runs this analysis is available in my college-football repository.
- The PageRank implementation used here is from python-graph, and I still haven’t changed its default scaling factor of 0.85.
- Data for the analysis was gathered from publicly available sites and APIs. I didn’t include it in my repository, but if you would like to use the data, just let me know!