Predicting the 2017 College Football Bowl Season with Pagerank
If you are more interested in the game predictions than the technical background, skip ahead to the Results section.
College football is unusual in the sparsity of its matchups vs. the number of teams – with 129 schools in its highest subdivision of play and only twelve regular season matchups for each team, it is simply impossible for any one team to play a large proportion of the field. Fans of other leagues, especially professional leagues like the NFL or NBA, have the luxury of seeing the majority of conflicts resolved head-to-head on the field. Many of the most prominent burning questions in college football never get this luxury. Is the Big Ten Conference better than the SEC? We could look at the two games they played against each other this year – Michigan beating Florida 60-25 in Week 1 and Purdue beating Missouri 55-29 in Week 3 – and haphazardly say “yes,” but there’s clearly not enough direct evidence to make that claim with a straight face. Is Alabama better than Ohio State? It’s hard to make any argument without invoking dubious transitivity of wins several times over or subjectively judging their on-field performance (the so-called “eye test”). Nevertheless, college football fans always manage to select arguments with which they can express certainty in their convictions that their team or their conference deserves more recognition and more respect in the postseason.
Technical Approach
This problem has intrigued me for a long time. I’m particularly drawn to its similarity to a well-studied problem on the web: ranking large sets where the available data indicating order is sparse relative to the size of the dataset. While the scale is very different and the web is much more sparse than college football matchups, it still seems like some of the approaches developed for ranking content on the web might be more appropriate for understanding college football than the mindsets fans apply to smaller leagues with more games, where on-field results and single-degree transitivity have more value for indicating top performers in a season. Perhaps the most prominent algorithm for ranking content on the web is Google’s PageRank, which considers a link from page A to page B as an “endorsement” of B by A, and values A based on a discounted sum of the values of all of the pages that link to it. Intuitively, this means that for a page to “rank higher,” it must be linked to by pages that also rank highly. If instead of web pages we consider college football teams, and instead of links we consider games with the loser “endorsing” the winner, this approach can be seen as combining some sense of “strength of schedule” with win-loss record – beating a highly ranked team adds to a team’s value tremendously, while beating an 0-11 team has close to zero value. Importantly, the fact that the algorithm is applied iteratively incorporates transitivity of wins to an extent, allowing it to produce meaningful results even when connectivity is fairly low within the graph, as in college football. In the past, I have applied PageRank to ranking conferences in light of postseason results at the end of the bowl season, which has often produced subjectively more aggreeable results than traditional methods, like ranking by win-loss percentages:
2016                    2015                    2014
1. ACC (0.169)          1. SEC (0.211)          1. Mountain West (0.119)
2. SEC (0.152)          2. Big Ten (0.175)      2. Big Ten (0.108)
3. Big 12 (0.104)       3. ACC (0.16)           3. SEC (0.108)
4. Big Ten (0.0869)     4. Pac 12 (0.116)       4. Pac 12 (0.0996)
5. Pac 12 (0.0826)      5. Big 12 (0.0855)      5. ACC (0.0781)
I have also used PageRank with some success as a feature in a model predicting AP poll results given a week’s game outcomes. Now, I want to extend this approach to predicting actual game outcomes. This weekend marks the beginning of the 2017 college football bowl season. Bowl games almost always produce matchups of teams from different conferences who rarely have played common opponents, so this is a good opportunity to see how well a PageRank-supported model can predict results between teams that are distant from each other in a graph of prior matchups.
Models
The approach I took was to separately predict the points that each team would score given the features:
pr_diff, the difference in PageRank between the team and their opponent. This was calculated using a graph of the entire regular season results. Initial models used unit weight for edges, and margin of victory was used in later experiments. Results are presented below for both.conf_pr_diff, the difference in PageRank between the teams’ conferences given regular season results. Unit weight was always used for edges.ap_rank_diff, the difference in the week 14 AP poll ranking between the team and their opponent. All unranked teams were treated as tied for 26.opp_points_allowed, the average points the opponent allowed per game in the regular season.ppg, the average points per game scored by the team.
I compared regression models using these feature vectors and points scored in regular season games on a training set of 90% of regular season games and with evaluation on a test set of the remaining 10% of regular season games. The following R^2 on each set of games was found for a simple linear regression and random forests models with two different sets of parameters:
| Model | Train R^2 | Test R^2 |
|---|---|---|
| Linear | 0.58 | 0.43 |
| Random Forest (min leaf samples=1) | 0.90 | 0.51 |
| Random Forest (min leaf samples=4) | 0.76 | 0.57 |
The intuition we can draw from these results is that a linear model isn’t ideal for fitting these data, which is unsurprising given the constrained ranges of all of the diff features. Another dynamic at play here is overfitting in the first random forest model, which is expected when the model is allowed to fit the data with arbitrarily precise leaves. By constraining the number of samples allowed at each leaf, I acheived a better test set R^2 than any of the other models I tried. I stuck with this model for the all of the results presented below, but may want to explore other regression models in the future.
Finally, I looked at feature importances in the random forest model and interestingly found that the team_pr feature commanded a 32% importance, with opponents’ points allowed and points per game closely following at 32% and 29% respectively. Surprisingly, neither conf_pr_diff nor ap_poll_diff had more than 5% importance in the final model. This could be due to the majority of games being within-conference between unranked teams, so I may have to revisit how to more heavily emphasize these features in the cases where they are nonzero, which will be much more common in the postseason than in the regular season games the model was trained on.
Results
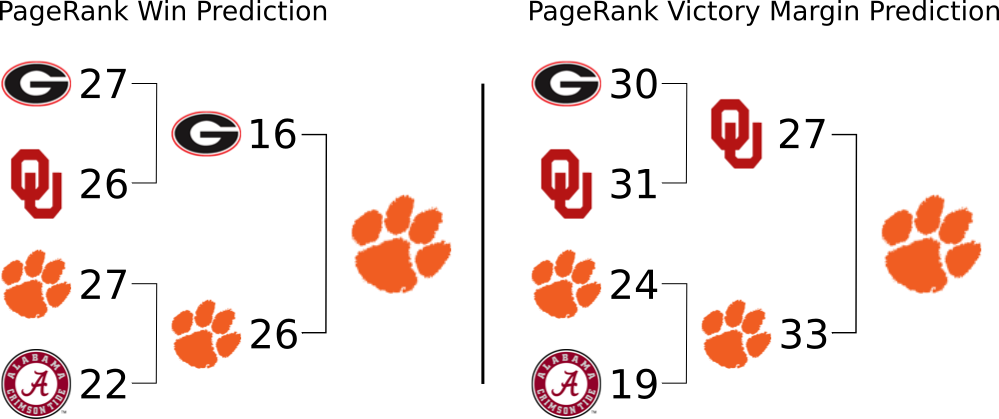
All of the following results were produced from a random forest model trained with leaves constrained to represent four or more samples. Results are broken down based on whether victory margin was used as an edge weight in PageRank, vs. having the same unit weight for all wins regardless of margin of victory. The results in each case are not radically different, but they do happen to produce a slightly different path through the playoffs – perhaps Oklahoma had more impressive wins weighted by margin of victory than Georgia did this season.
| Bowl Game | PageRank on Wins | PageRank on Victory Margin |
|---|---|---|
| New Orleans Bowl | troy 33 unt 22 |
troy 29 unt 26 |
| Las Vegas Bowl | #25 boise state 46 oregon 32 |
#25 boise state 26 oregon 35 |
| New Mexico Bowl | marshall (wv) 25 colorado state 16 |
marshall (wv) 25 colorado state 21 |
| Cure Bowl | western kentucky 22 georgia state 22 |
western kentucky 22 georgia state 19 |
| Camellia Bowl | middle tenn state 25 arkansas state 26 |
middle tenn state 21 arkansas state 24 |
| Boca Raton Bowl | akron 26 fau 33 |
akron 21 fau 34 |
| Frisco Bowl | louisiana tech 21 smu 51 |
louisiana tech 24 smu 47 |
| Gasparilla Bowl | temple (pa) 18 fiu 19 |
temple (pa) 22 fiu 20 |
| Bahamas Bowl | uab 27 ohio 27 |
uab 29 ohio 33 |
| Idaho Potato Bowl | central michigan 21 wyoming 24 |
central michigan 23 wyoming 25 |
| Birmingham Bowl | texas tech 31 #23 south florida 38 |
texas tech 21 #23 south florida 37 |
| Armed Forces Bowl | s diego state 18 army 23 |
s diego state 24 army 19 |
| Dollar General Bowl | appalachian state 26 toledo (oh) 33 |
appalachian state 25 toledo (oh) 37 |
| Hawaii Bowl | fresno state 19 houston 28 |
fresno state 12 houston 23 |
| Heart of Dallas Bowl | utah 29 west virginia 30 |
utah 28 west virginia 28 |
| Quick Lane Bowl | duke 21 niu 15 |
duke 23 niu 17 |
| Cactus Bowl | kansas state 40 ucla 28 |
kansas state 36 ucla 30 |
| Independence Bowl | southern miss 19 florida state 21 |
southern miss 13 florida state 19 |
| Pinstripe Bowl | iowa 26 boston college 18 |
iowa 22 boston college 20 |
| Foster Farms Bowl | arizona 32 purdue 31 |
arizona 20 purdue 33 |
| Texas Bowl | texas 31 missouri 29 |
texas 30 missouri 25 |
| Military Bowl | virginia 26 navy 29 |
virginia 24 navy 34 |
| Camping World Bowl | #22 virginia tech 30 #17 oklahoma state 28 |
#22 virginia tech 27 #17 oklahoma state 36 |
| Holiday Bowl | #21 washington state 25 #18 michigan state 24 |
#21 washington state 22 #18 michigan state 26 |
| Alamo Bowl | #15 stanford 17 #13 tcu 27 |
#15 stanford 17 #13 tcu 25 |
| Belk Bowl | wake forest (nc) 33 texas a&m 33 |
wake forest (nc) 38 texas a&m 34 |
| Sun Bowl | nc state 36 arizona state 21 |
nc state 35 arizona state 19 |
| Music City Bowl | kentucky 24 #20 northwestern 21 |
kentucky 22 #20 northwestern 18 |
| Arizona Bowl | n mex state 35 utah state 39 |
n mex state 36 utah state 37 |
| Cotton Bowl | #8 usc 15 #5 ohio state 43 |
#8 usc 19 #5 ohio state 45 |
| TaxSlayer Bowl | louisville 18 #24 mississippi state 39 |
louisville 22 #24 mississippi state 41 |
| Liberty Bowl | iowa state 37 #19 memphis 28 |
iowa state 33 #19 memphis 21 |
| Fiesta Bowl | #12 washington 16 #9 penn state 38 |
#12 washington 20 #9 penn state 34 |
| Orange Bowl | #6 wisconsin 21 #11 miami (fl) 23 |
#6 wisconsin 19 #11 miami (fl) 25 |
| Outback Bowl | michigan 22 south carolina 17 |
michigan 30 south carolina 15 |
| Peach Bowl | #10 ucf 22 #7 auburn 31 |
#10 ucf 17 #7 auburn 34 |
| Citrus Bowl | #14 notre dame 38 #16 lsu 23 |
#14 notre dame 45 #16 lsu 26 |
| Rose Bowl | #3 georgia 27 #2 oklahoma 26 |
#3 georgia 30 #2 oklahoma 31 |
| Sugar Bowl | #4 alabama 22 #1 clemson 27 |
#4 alabama 19 #1 clemson 24 |
| National Championship | #3 georgia 16 #1 clemson 26 |
#2 oklahoma 27 #1 clemson 33 |
In January when all is said and done, I intend to loop back and evaluate both the performance of this model for predicting individual scores in bowl games as well as its performance in predicting outcomes. The model valuing margin of victory produces fairly different predictions from the model that follows the maxim “a win’s a win’s a win,” so it will be particularly interesting to see if one performs significantly better than the other.
References and Code
- The script that runs this analysis is available in my college-football repository.
- The PageRank implementation used here is from python-graph, and I didn’t change its default scaling factor of 0.85.
- Data for the analysis was gathered from publicly available sites and APIs. I didn’t include it in my repository, but if you would like to use the data, just let me know!